
Solar and wind are examples of renewable energy sources. However, capturing solar and windenergy is not renewable because very large amounts of energy are required to manufacture both solar panels and wind turbines, which also have a limited lifespan of 20-25 years. In fact, no energy sources today are renewable, which makes the whole discussion about renewable energy sources irrelevant.
However, energy supply must be sustainable to create a sustainable society. An early and widely accepted definition of “sustainable development” is found in the Brundtland Commission’s report “Our common future“, June 1987: “Development that meets current needs, without removing the opportunity for future generations to meet their needs.”
One way to assess the sustainability of an energy type is to compare the EROI values of different energy sources. EROI is the ratio of energy obtained in relation to that invested in that energy source throughout its life cycle, ie.
EROI = energy gathered / energy invested
Weißbach[1] estimated that the minimum EROI value for creating a sustainable society is about 7 for the United States and the European Union (slightly lower for less developed societies). Lower EROI can not sustain our society at our level of complexity or with our standard of living. Economies with access to energy sources with higher EROI have greater potential for economic expansion and diversification.
Euan Mearns states that “It is assumed that EROI > 5 to 7 is required for modern society to function. At low EROI values, one must invest increasing amounts of available energy to obtain additional energy to drive society. In a society with energy sources with EROI value below 5-7, such a large number of people would work for the energy industry that there would not be enough people left to fill all the other positions that our current society offers ”.
A good example of why a higher EROI value than 1 is needed to run a society is given by C. Hall and P. Prieto as follows:
”They studied how much oil would need to be extracted to drive a truck, including energy to use the energy. So we added the energy to get, refine and deliver the oil (about 10% in each step) and then the energy to build and maintain roads, bridges, vehicles and so on. We found that you needed to extract 3 liters to use 1 liter in the fuel tank to drive the truck, i.e. an EROI of 3: 1 was needed. But this did not even include the energy to load anything into the truck (e.g. grains) or for the energy for the depreciation of the truck value and the roads and to pay for domestic needs, schooling, medical care. Pretty soon it looked like we needed an EROI of at least 10: 1 to take care of society’s minimum requirements and maybe 15: 1 for a modern civilization.”
Figure 1 schematically shows the cumulative energy production and use of energy over the life of an energy system.
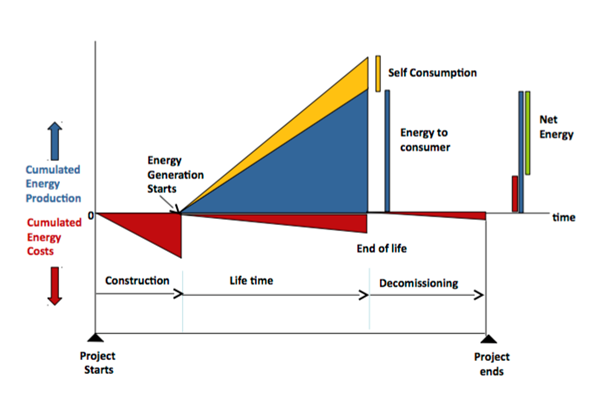
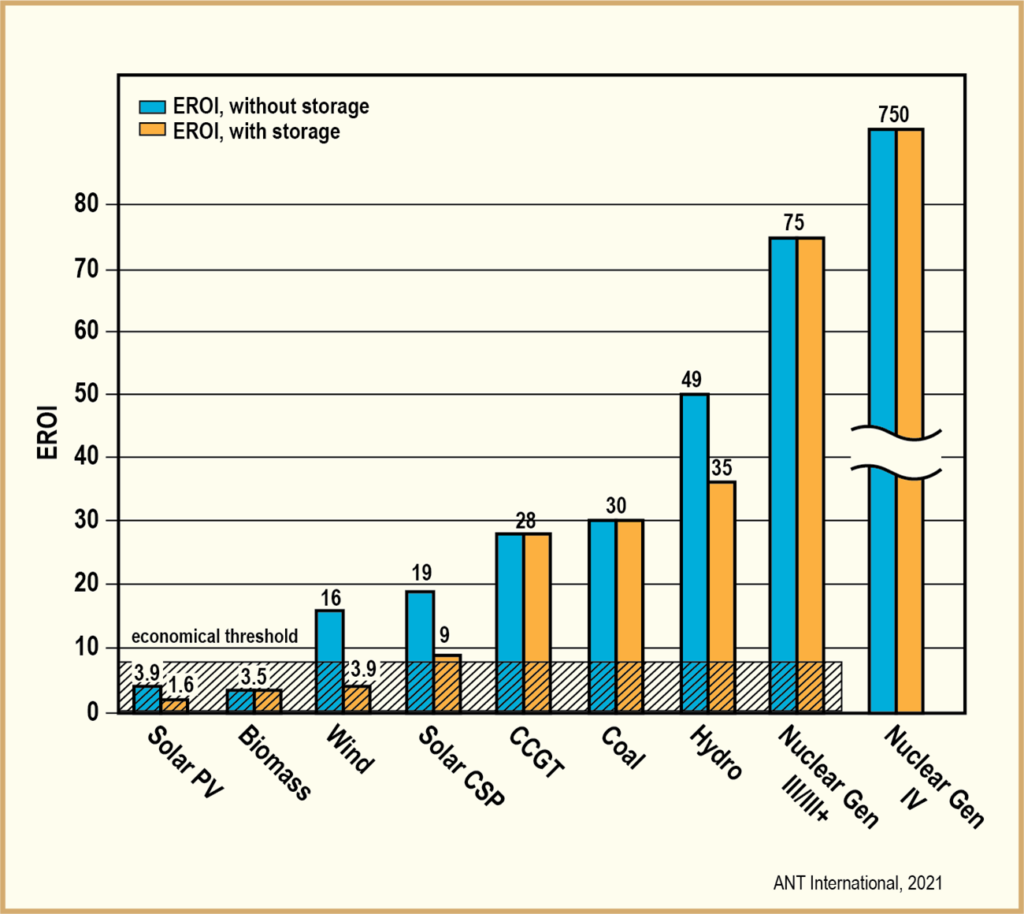
Figure 2 clearly shows that nuclear power (Generation III/III+ – i.e. the reactors types that are being built today) has the largest EROI value of 75. The corresponding EROI values with energy storage is below 4 for windenergy while solarenergy varies between EROI values of 1.6 to 9. Fuel-based sources such as biomass, coal, natural gas and nuclear power have their storage in the fuel and therefore require not external storage while this is an important factor for weather dependent sources such as solar, wind and hydropower. Since some sources require energy storage, there are two values for each source, with and without energy storage in Figure 2. Weißbach uses the least energy-intensive storage technology, pumped hydropower, which lowers EROI the least. This means that the EROI value of energy storage is most representative of each energy source.
Several blogs promoting wind and solar energy often use unrealistically high EROI values by:
1) Assume that the wind/solar installations produce more electricity and have a longer service life than in reality
2) Include all electricity produced regardless of whether it is needed or not.
- Producing an enormous amount of electricity from wind and solar that exceeds the need does more harm than good as it makes the electricity grid unstable with the risk of grid collapse, Figure 4. The amount of electricity produced and consumed at any given moment must be equal. If the difference between produced and consumed electricity is too great, the grid collapses, which means that all electricity users will be without electricity for a certain period of time. On the other hand the amount of electricity from power soruces such as e.g. nuclear, hydro, coal and natural gas is continously being adjusted to the specific need.
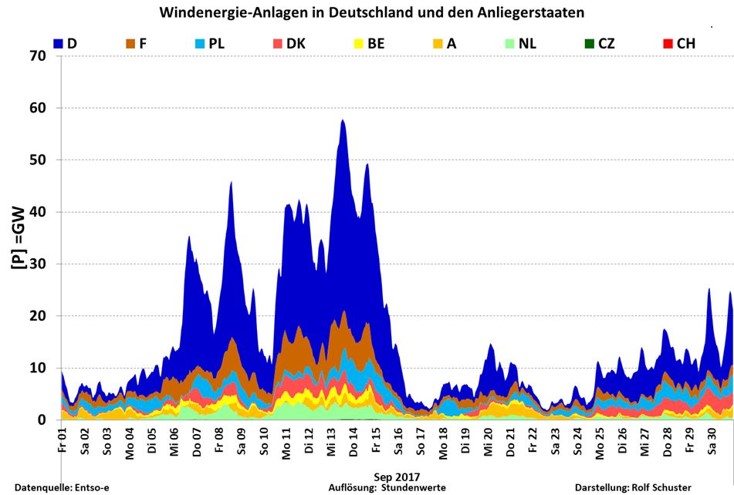
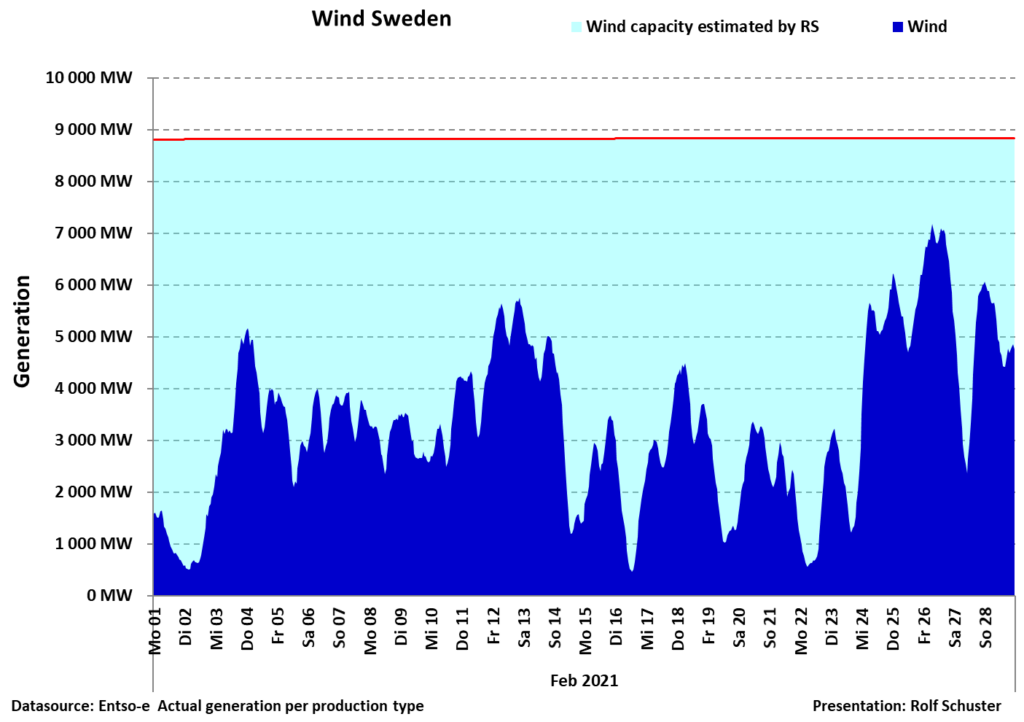
- When it is cold in the winter e.g. in Sweden, high pressure prevails resulting in very little wind. Figure 5. The possibility of producing electricity on a very cold winter day in February when electricity consumption is at its highest has therefore a great value.
Johan Montelius showed that in 2020, as much as 76% of all windenergy production was exported mostly at electricity prices below the wind production cost (and in several cases Sweden had to pay the windenergy importing country) because Sweden did not need this electricity. Thus only 24% of wind power production was usable. This means that for wind and solarenergy production, only the energy needed by the country should be included in the EROI analyzes, while all “overproduction” should be omitted. It is of course obvious that the oil spills from the Deep Water Horizon in the Gulf of Mexico should not be included in the total amount of oil produced.
The example (from many) below shows how the EROI value of windenergy is manipulated:
- An EROI value of 54 was calculated for a wind farm of 150 Siemens 4 MW wind turbines (offshore) by assuming that the capacity factor was 50% (i.e. the wind turbines produce electricity corresponding to 50% of their maximum capacity) and a service lifetime of 30 years.
- In a very comprehensive study of a large number of offshore wind turbines in both the UK and Denmark by Professor Gordon Hughes, the actual capacity factor was 35% and decreased by 4.5% every year, so after 20 years the capacity factor was only 15%, which gives an average value of 23% over the entire lifetime of 20 years. This means that the corrected EROI value becomes:
- 54 * (23/50) * (20/30) = 16. In addition, Johan Montelius showed that only about 24% of the wind energy was useful resulting in an EROI value of 16*0.24= 3.9% which is exactly the EROI value estimated by Weißbach in Figure 2.
Conclusions
One way of assessing the sustainability of different types of energy is to compare their EROI values. EROI is the ratio of energy obtained in relation to the energy invested throughoutthe entire life cycle of the energy source. The EROI values are for
• Nuclear power gen. III / III + (reactors being built today) – 75
• Gen. 4 – about 750 (estimated value)
• Solar cells- 1.9 to 9
• Wind – 3.9
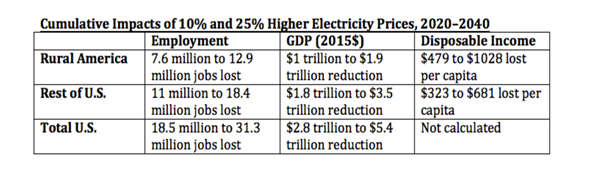
Weißbach believes that a minimum EROI value of about 7 is needed for sustainable energy production in a developed country. Lower EROI can not sustain our society at our level of complexity or with our standard of living and often means increased electricity prices. Figure 4 shows how the electricity price is affected by the percentage of wind and solar production (low EROI values). A study by M. Febrizio clearly shows that higher electricity prices have a very negative impact on both jobs and economic growth, Table 1.
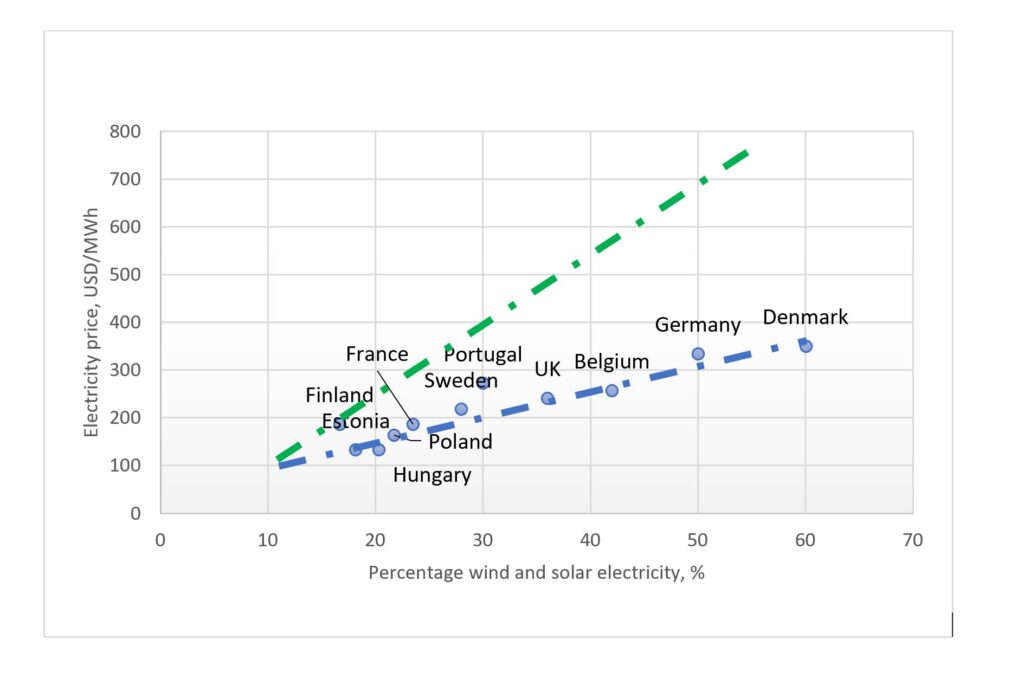
Table 1 – It there is a 25 % increase in US electricity prices from 2020-2040, there will be a loss of 31 million jobs and a reduction in GDP of USD 5400 billion dollars.
Wind and solar energyproduction are thus neither renewable nor lead to a sustainable society. It is obvious that nuclear power is the best option for a sustainable society with environmentally friendly, reliable, safe and inexpensive electricity.
[1] Weissbach, D, Ruprecht, G, Huke, A, Czerski, K, Gottlieb, S, Hussein, A, 2013. Energy intensities, EROIs, and energy payback times of electricity generating power plants. Energy, 2013-04-08 (submitted), pp. 210-221.
[2] Kelly, M J, (referenced), 2016. Energy Return On Investment. MeteoLCD Weblog, 2016-05-29.
[3] DOE, 2015. Quadrennial Technology Review – An assessment of energy technologies and research opportunities – Chapter 10: Concepts in Integrated Analysis. Quadrennial Technology Review 2015, (US Department of Energy.).