What impacts the price of electricity
The price of electricity is determined by the balance between supply and demand of electricity. At any given moment, the amount of electricity produced must be equal to the amount consumed, otherwise the electricity grid collapses and everyone becomes without electricity for one to several days, perhaps longer.
• Demand for electricity increases during the day when large industries are up and running and of course also during the cold part of the year.
• The supply of electricity production in e.g. Sweden and France is mainly produced from hydropower and nuclear power. Combustion of biofuels also contributes to energy supply. The contribution from wind power is completely weather dependent and when it is not blowing, the wind power does not produce electricity.
The electricity price is, however, controlled not only by supply and demand for electricity but also by the electricity network’s ability to transport electricity. Two adjacent electricity areas get the same price as long as the transmission of electricity from one area to another is lower than the maximum transmission capacity.
Figure 1 describes the different electricity prices at a certain time in northern Europe on 15 November, 2021 (Nordpool[5]) and below explains why we get such large differences in electricity prices in different areas.
In SE1 we have such a large surplus of electricity from cheap hydropower resulting in a low electricity price of 14 öre/kWh (corresponding to 14 EUR/MWh), despite the fact that SE1:
Exports the maximum amount of electricity that the electricity networks to Finland, FI, allow (marked with a red arrow). As the production cost for electricity from hydropower is very low, the hydropower owners in SE1 can thus make large profits by selling a certain part of their electricity to Finland, where the electricity price was 98 öre / kWh (same as 98 EUR/MWh) at this time.
Exports electricity to SE2 and to Norway (NO4) below the maximum transmission capacity in the electricity networks (marked with a black arrow), which leads to the same electricity price in these 3 electricity areas (SE1, SE2 and NO1).
In SE4, there is too little supply of electricity by Sweden shutting down 2 well-functioning nuclear power reactors (Barsebäck 1 and 2) prematurely through political decisions, which has led to significantly higher electricity prices.
The supply of electricity in SE4 (partly imports from SE3 and certain electricity production in SE4) is sufficient to export the maximum that the electricity cables to Denmark (DK2) and Poland (PL) can handle. However, the supply of electricity in SE4 is not sufficient to export maximum to Germany (DE). Therefore, SE4 imported electricity from Lithuania (LT), which means that SE4 “imports” the high electricity prices from both DE and LT.
If we had kept the decommissioned 2 nuclear power reactors in SE4, its electricity production and the transfer of electricity from SE3 would have meant that SE4 could export maximum to DE and LT and had a sufficient surplus of electricity in SE4 to get a low electricity price also in SE4.
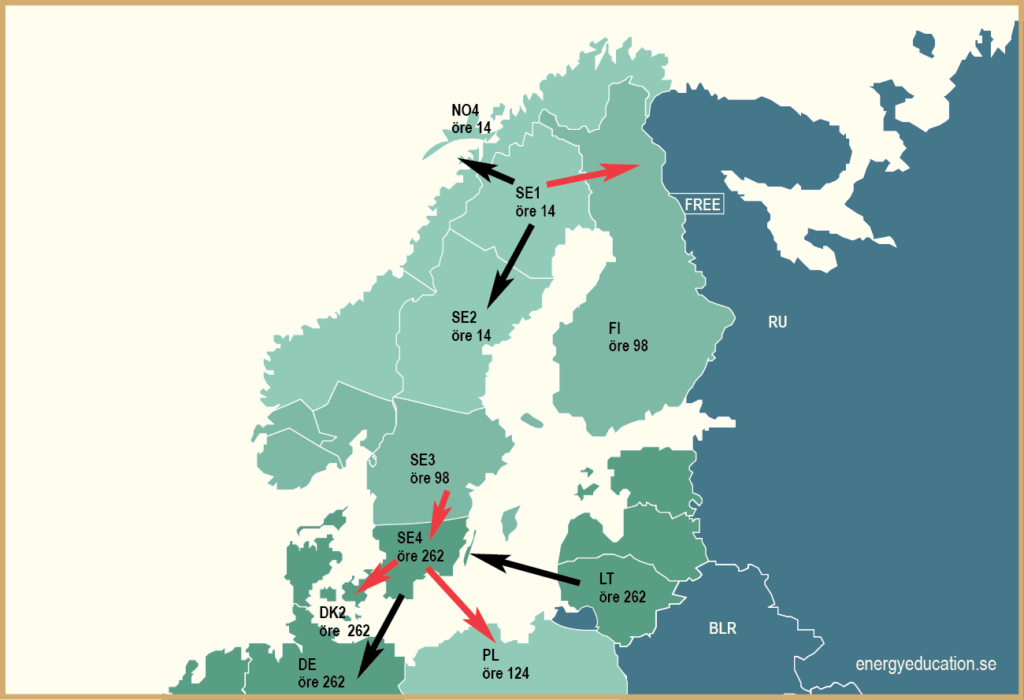
Figure 1 – If there had been no restrictions on transmission capacity between different areas, the price of electricity would have been 86 öre/kWh (corresponding to 86 EUR/MWh) throughout Northern Europe at this time. The different prices in different areas are thus due to a lack of transmission capacity between different areas. Red arrows indicate that the transmission of electricity between two areas is limited by the transmission capacity in the electricity networks / cables, which leads to different electricity prices in the two adjacent areas. Black arrows show that the transmission of electricity is lower than the maximum transmission capacity, which results in the same electricity price in the adjacent areas. Modified figure from (Nord Pool (nordpoolgroup.com), [5]).
Pricing
The common electricity price is determined in the individual electricity areas, e.g. SE1-SE4 for Sweden, one day in advance for each hour in the coming day. The purchase bids from the electricity users are matched against the producers’ sales bids through an auction procedure. The system also includes the electricity that is imported (Ei [6]).
The electricity price is based on the marginal cost, ie. cost increase that arises if electricity production is increased by an extra produced energy unit, kWh, and differs significantly depending on how it is produced. For hydropower and wind power, the marginal cost is very low and slightly higher for nuclear power (mainly uranium costs for nuclear fuel), while fossil-based electricity has a very high marginal cost. However, the electricity price does not correspond to the actual total cost of production since e.g. capital cost, i.e. the cost to build the facitity, is omitted.
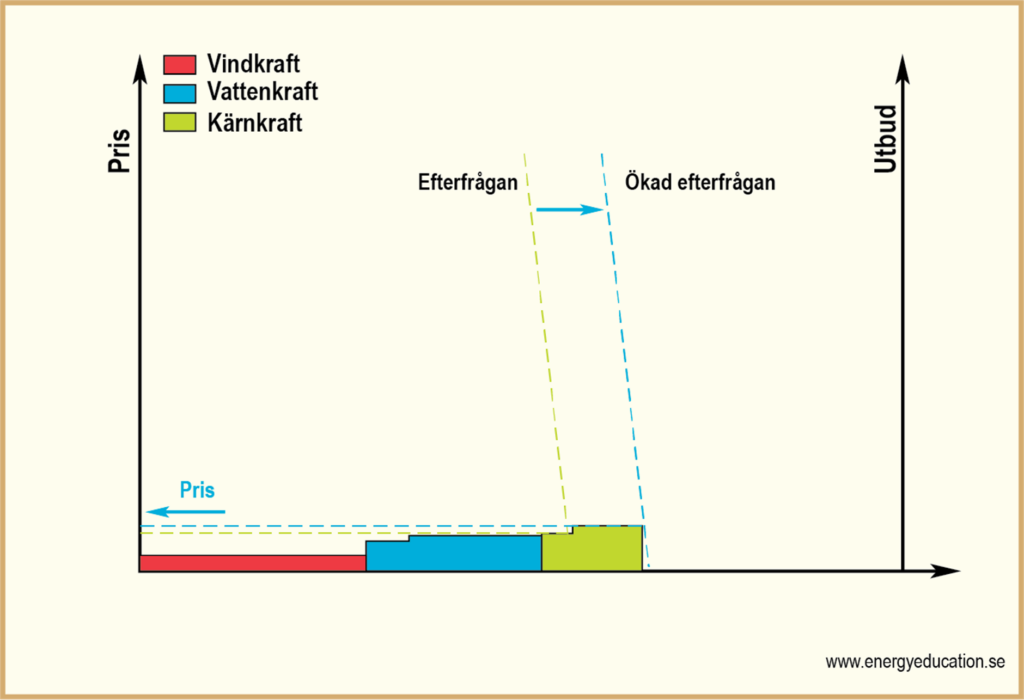
Figure 2 shows the situation on a day when a lot of wind is produced when demand is small (e.g. a weekend with moderate temperatures), which leads to low electricity prices. The figure also shows how an increase in demand (e.g. a Monday) for electricity leads to a moderate increase in the price of electricity.
Why do we have such high electricity prices today
Electricity prices can be kept low throughout the year only if electricity production is based primarily on hydropower and nuclear power. The advantage of these energy sources is also that the energy is produced when needed, planned production. On average, produced e.g. Vattenfall’s 5 nuclear power plants 93.9% of their maximum capacity during the winter of 2018-2019 (Vattenfall [9]).
Electricity production from wind and solar is on the verge of non-existent when it is coldest in Sweden. For example, solar energy produced 0% of its maximum capacity throughout Feb. 2019 (it is normally the month in northern Europe when the need for electricity is greatest). For wind power, production was lower than 10% of its maximum capacity on several occasions during Feb. 2019 (Åström S., 2019, (Klimatsans,[10]).
For most of the year, wind power in Sweden produces too little electricity for Sweden to be able to export more electricity to the continent than the maximum transmission capacity of the power cables that connect Sweden to the continent. On these occasions, Sweden will thus “import” the high electricity prices from the continent by allowing Swedish electricity producers to sell their electricity at very high prices to the continent and make very large profits that Swedish electricity consumers have to pay. The Swedish customers have to pay the same high price of electricity to get any electricity.
The reason for the high electricity prices is due to the need to use fossil fuels (coal, oil and natural gas) and the prices for fossile fuels has escalated from 2020 to today by between 250 -600% (Market business insider [11], [12], [13]) and the introduction of carbon dioxide emissions where the price of emissions increased by 700% from 2017 to 2021 (Råvarumarknaden, [14]) see Figure 3. Interesting to note that the high prices we see today have nothing to do with the ongoing conflict between Russia and Ukraine because we had very high electricity prices long BEFORE the conflict.
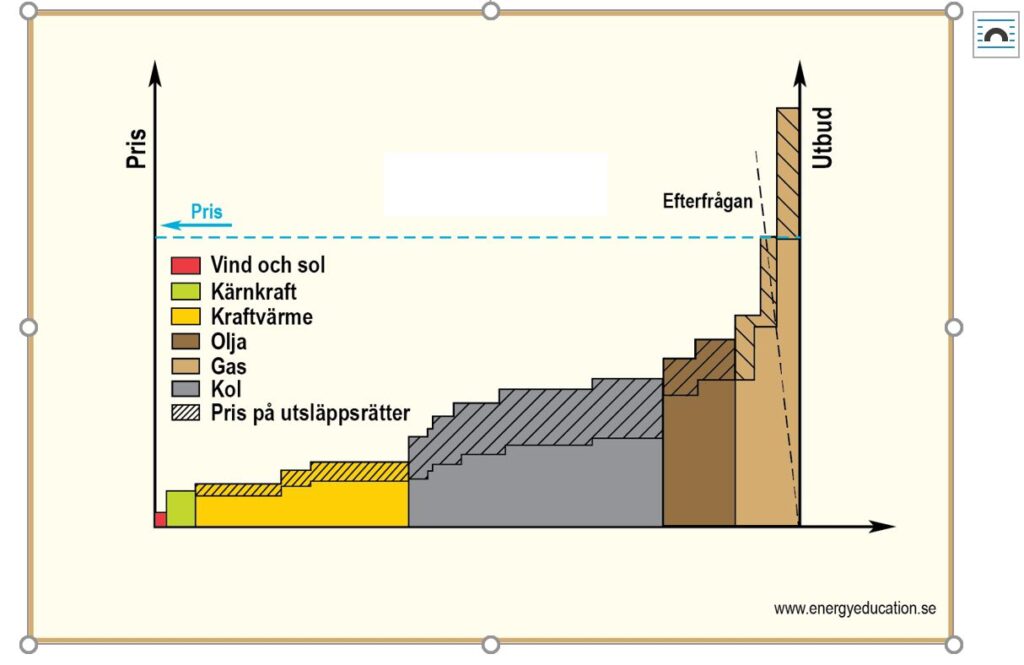
Figure 3 Typical electricity production in Germany when wind and solar almost as always produce so little electricity that additional electricity production is needed from fossil fuels. Vind och sol is wind and solar, kärnkraft is nuclear power, Kraftvärme is cogeneration, Olja is oil, Kol is coal, Pris på utsläppsrätter is price to allow carbon dioxide emissions. Modified figur 5 from Aktörer på el- och naturgasmarknaderna (gov.se), [8].
Figure 4 shows how electricity production in Germany during November – December 2017 largely takes place through the combustion of coal and oil, regardless of how much wind and solar is produced.
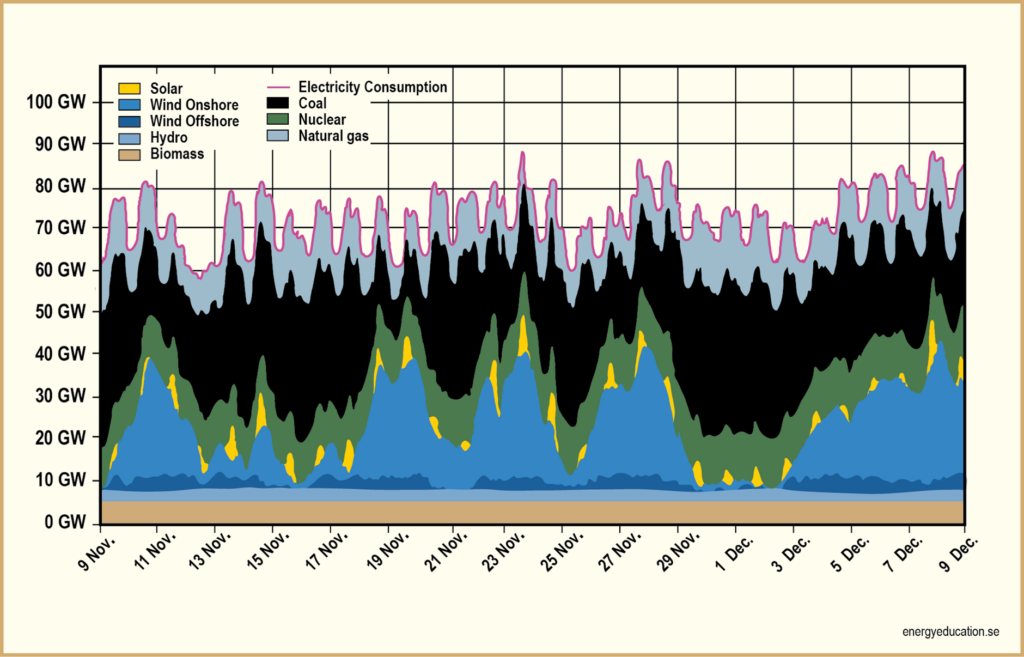
Figure 4 – Electricity production in Germany during Nov.- Dec. 2017 of different energy sources. The contribution from nuclear power (green color) is today much smaller than the figure shows due to Germany’s premature closure of well-functioning nuclear power plants, which today is being replaced by even more electricity from fossil fuels. Modified figure from “Agora Energiewende” [15].
Figure 5 clearly shows how southern Sweden (SE4) often “imports” the high German electricity prices due to Swedish politicians relying on replacing reliable nuclear power with unreliable electricity from wind power. It is the same situation from France that produce inexpensive electricity from hydro and nuclear but import high electricity prices from Germany. In other cases, France are importing very high electricity prices from Italy where electricity is mainly produced from gas turbins.
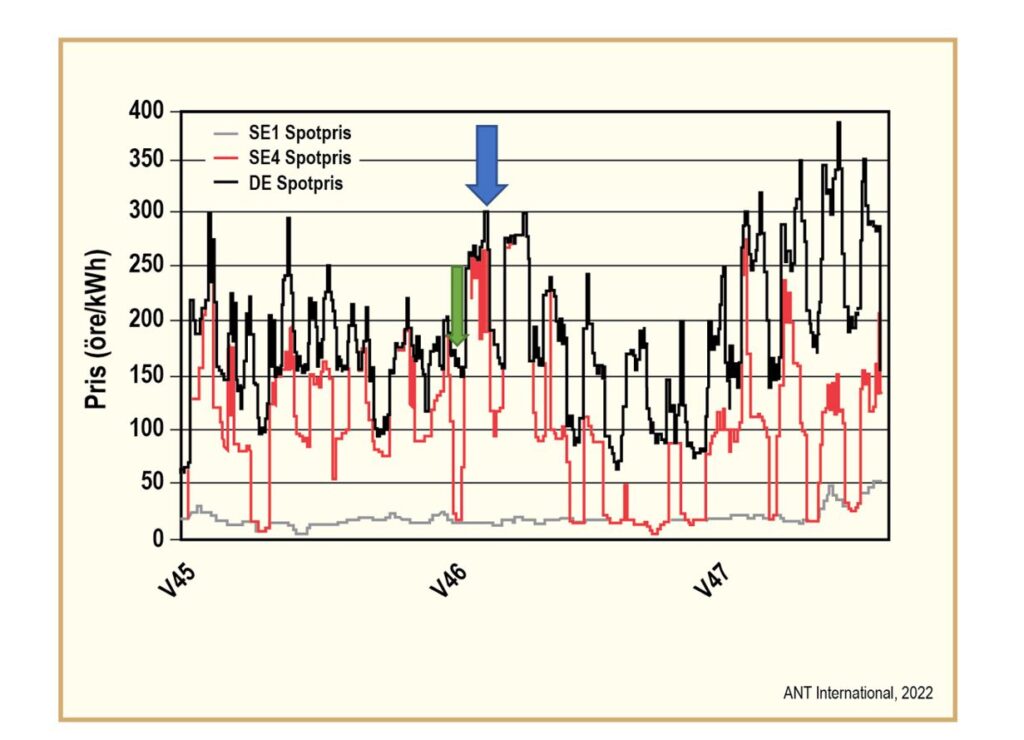
Figur. 3 – Prices per hour in SE1, SE4 and Germany (DE) during weeks 45-47, 2021. Germany has consistently high electricity prices throughout this period, while the electricity price in SE4 varies greatly from low to high prices. The green arrow shows when SE4 (red curve) had so much available electricity that SE4 could export maximum electricity to the continent and also have so much surplus electricity that SE4 could get low electricity prices. The blue arrow, on the other hand, shows almost the same high electricity price in SE4 as Germany (DE) due to the fact that SE4 did not have enough electricity surplus to export maximum electricity to the continent at this time. SE1 has consistently low electricity prices due to the fact that SE1 has so much surplus electricity that they can export maximum to other electricity areas what the electricity networks can handle. Modified figure according to SKM Market Predictor, Nord Pool, Nuläget på elmarknaden (energimyndigheten.se), [16].
More nuclear power leads to lower electricity prices, Figure 4.
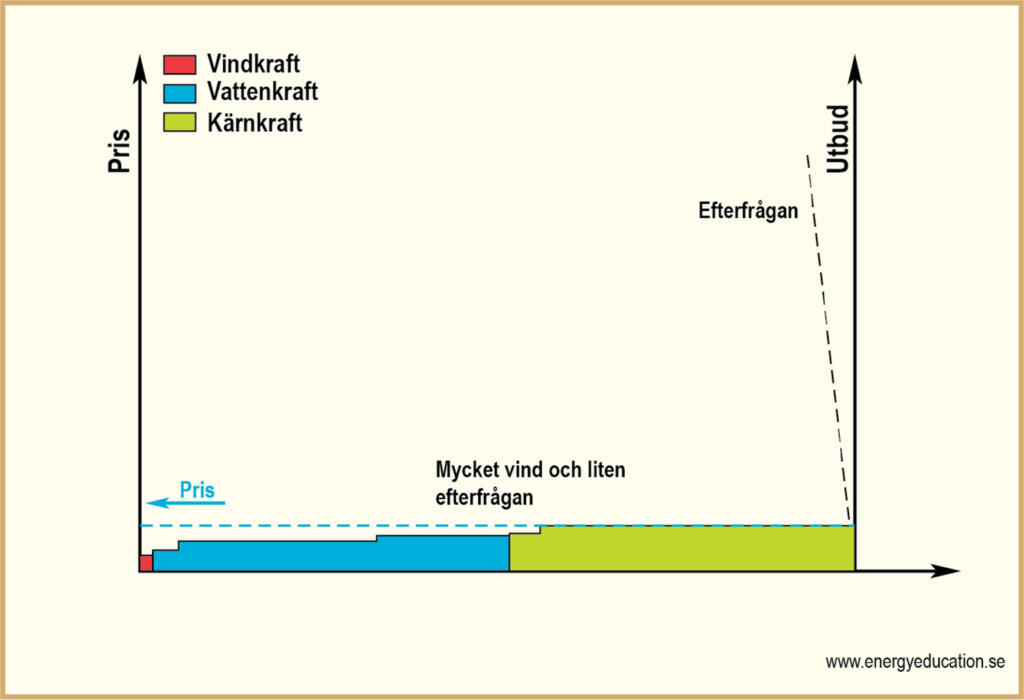
Figure 4 – With expanded nuclear power in Sweden, we would again have low electricity prices throughout the country by not having to “import” high electricity prices from the continent, especially from Germany, see Figure 3. More access to nuclear power leads to a wider bar for nuclear power and leads to low electricity prices despite high demand. Modified Figure 5 from Aktörer på el- och naturgasmarknaderna (gov.se), [8].
More nuclear power leads to lower electricity prices was also shown in a study by Energiforsk where it was concluded that Sweden could have halved the price of electricity in the autumn of 2021 if Ringhals 1 and 2 had not been closed down (Welderlang L., 2022, [17]. “Current restrictions on transmission capacity to other countries mean that additional electricity largely stays in Sweden and therefore has a major impact on prices here by reducing the risk of having to import high electricity prices based on fossil fuels from the continent” [18].
Sweden would thus have very low electricity prices throughout the year if Sweden had such a high electricity production in southern and central Sweden (SE3 and SE4) that we could export electricity to other countries clearly exceeding the maximum transmission capacity of the electricity cables / electricity networks to other countries (Norway, Denmark, Germany, Poland, Lithuania and Finland).
Increasing electricity production from wind and solar will NOT reduce the electricity prices
Credit: Nicolas Waeckel and PNC-France
We often hear how proponents of wind power often repeat the mantra “it always blows somewhere”, but nothing can be more incorrect. It turns out that the weather systems are so big that if it blows a little, for example in Sweden, the situation is the same throughout Northern Europe. Linnemann T. and Vallana G.S [19] showed that, Figure 5:
- The total wind production in 18 EU countries in 2017 amounted to only 22-24% of the electricity that the wind turbines could maximally produce (the average value of the blue bars compared to the upper blue line for the dashed blue area).
- It should e.g. can be compared with nuclear power that produces planable electricity between 90-100% of maximum capacity when the electricity is needed.
- It turns out that when the wind is at its lowest, the total wind production in these 18 countries is only 4-5% of the maximum capacity for the wind turbines (compare the minimum values for the blue bars, eg Sept. 2017, with the top line for the dashed blue area).
- In 2017, all approximately 70,000 wind turbines in 18 EU countries produced only 12% of these countries’ total electricity needs for 2017 (compare the upper yellow curve with the average value for the blue bars) and when the wind turbines produced the least, only 2% of the 18 EU countries’ total electricity needs (compare the upper yellow curve with the minimum values for the blue bars).
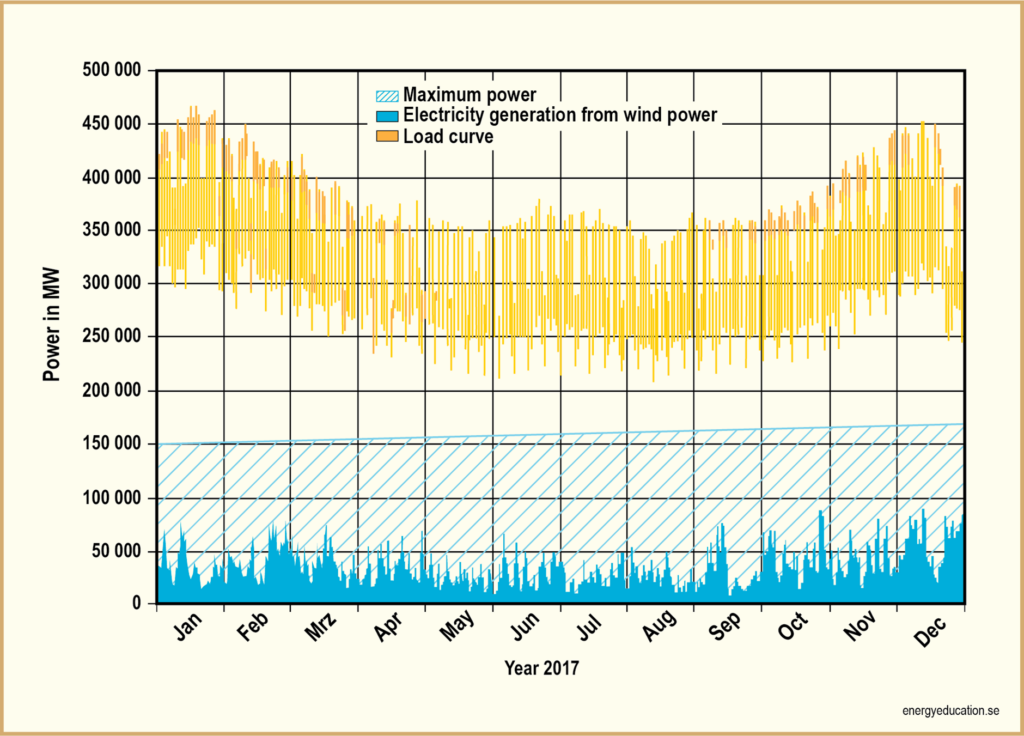
Figure 5 Total electricity demand (“Load curve”) and total electricity production for wind in 2017 for 18 countries in Europe in 2017. “Maximum power” shows how much electricity could be produced from wind if all wind turbines in these countries were to produce electricity. The blue bars at the bottom of the figure shows the total actual wind production in 18 EU countries. Modified figure according to Linnemann T. and Vallana G.S., [19] 2019.
The conclusions of the authors Linnemann T. and Vallana G.S., [19] to this very insightful analysis are that since wind power can not supply electricity when it is needed most, reliable electricity production (such as e.g. nuclear and, hydro) is needed which can replace the maximum possible electricity production from wind power. It is also concluded that because the weather systems are so extensive, each country must be responsible for its own electricity supply – it is thus not possible to rely on imports of electricity from other countries.
The same conclusion can be drawn regarding electricity from solar panels that are even more inefficient than wind power as solar only delivers 10-12% (throughout 2020) of maximum capacity in northern Europe (including Sweden) [20], and e.g. 6% during the winter (during the month of Feb. 2022 in Germany) Tysk el februari 2022 | KLIMATSANS [21] and 0% during Feb. month in Sweden Svensk el februari 2022 | KLIMATSANS [22].
Conclusions
“The end result is that Sweden needs fossil power from the continent to meet demand now. As Sweden is electrically connected with the rest of Europe, the price is not only set according to Swedish production and demand, but is affected by the price of electricity in neighboring countries. If the price of electricity is high in Germany, it pays to export Swedish electricity there. It reduces supply in Sweden with a higher price here as a result, until prices have leveled off, or the lines between the countries put a stop to further transfer ” (Blomgren J. [7]).
Sweden’s politicians have caused the high electricity prices in southern and central Sweden that we see today due to Sweden shutting down 6 of 12 well-functioning nuclear power plants prematurely through political decisions and trying to replace this electricity production with wind turbines. It is the same situation in Germany. Thanks’ to Germany most countries in Europe has very high electricity prices. Germany does not produce enough inexpensive electricity since they have phased out most of their nuclear power plants and replaced them with wind and solar farms that needs to be supplemented with electricity production from expensive fossile fuel. The high electricity prices in Germany is exporter to the neighbouring countries e.g. France.
As the weather systems are very large, this means that when wind and solar produce very little electricity, the situation is the same throughout northern Europe (including Sweden). This means that a further expansion of wind power in Sweden or any other country in Europe will not change the situation with high electricity prices in Sweden and other European countries because we import the very high electricity prices from expensive electricity production from fossil fuels when there is a little wind in northern part of Europe.
By ending all expansion of wind power in Sweden and Europe and instead expanding nuclear power in, we can avoid “importing” the high electricity prices due to the combustion of fossil fuels which is a result of the meaningless expansion of wind and solar.
Sources:
[1] Lindholm K.,”Kundens elkostnader”, Energiföretagen, Kundens elkostnader – Energiföretagen Sverige (energiforetagen.se), 2021.
[2] Information från hemsidan ”Härryda Energy”, Härryda Energi (harrydaenergi.se), 2022.
[3] Information från hemsidan ”Hem”, Just nu stiger elpriset – vad beror det på? l HEM, 2022.
[4] Information från hemsidan ”Elspot”, Dagens spotpris – elpriset idag per kWh – Dagens spotpris per kWh för Sverige på Nordpool, Nordiska elbörsen (elspot.nu), 2022.
[5] Modiferad information från hemsidan ”Nordpool”, Nordpool, 2022.
[6] Information från hemsidan ”ei”, Så här fungerar elmarknaden – Energimarknadsinspektionen (ei.se), 2022.
[7] Blomgren J.,”Dyr, osäker och smutsig el är det nya normala”, Smedjan, Dyr, osäker och smutsig el är det nya normala (timbro.se), 2021.
[8] Energimarknadsinspektionen, ”Underlagsrapport till Energikommissionen”, 2017.
[9] Information från hemsidan ”Vattenfall”, Hög tillgänglighet från kärnkraften i vinterkylan – Vattenfall, 2019.
[10] Information från hemsidan ”Klimatsans”, Svensk el februari 2019 | KLIMATSANS, 2019.
[11] Information för olja från hemsidan ”Markets business insider”, Brent crude oil – 2022 Data – 1970-2021 Historical – 2023 Forecast – Price – Quote (tradingeconomics.com), 2022.
[12] Information för kol från hemsidan ”Markets business insider”, Coal PRICE Today | Coal Spot Price Chart | Live Price of Coal per Ounce | Markets Insider (businessinsider.com), 2022.
[13] Information från hemsidan ”Markets business insider”, Natural Gas PRICE Today | Natural Gas Spot Price Chart | Live Price of Natural Gas per Ounce | Markets Insider (businessinsider.com), 2022.
[14] Information från hemsidan ”Råvarumarknaden”, Priset på utsläppsrätter i Europa är rekordhögt (ravarumarknaden.se), 2021.
[15] Modifierad information från hemsidan ”Agora Energiewende”, Agora Energiewende (agora-energiewende.de), 2017.
[16] Energimyndigheten, ”Nuläget på elmarknaden”, 2021.
[17] Welderlang L., ” Energiforsk: Halva elpriset i höstas om två reaktorer inte hade lagts ner”, Energiforsk: Halva elpriset i höstas om två reaktorer inte hade lagts ner – Cornucopia? , 2022
[18] Information från hemsidan ” Energiforsk”, Större elproduktion hade kunnat ge lägre elpriser | (energiforsk.se), 2022.
[19] Linnemann T. och Vallana G.S.,”Wind energy in Germany and Europe”, VGB PowerTech 3, VGB PowerTech 3 (2019), 2019.
[20] Information från hemsidan ”Ourworldindata”, Solar energy generation vs. capacity, 2020 (ourworldindata.org) 2020.
[21] Information från hemsidan ”Klimatsans”, Tysk el februari 2022 | KLIMATSANS
[22] Information från hemsidan ”Klimatsans”, Svensk el februari 2022 | KLIMATSANS
