The following is the text accompanying the talk given by Professor Gordon Hughes, School of Economics, University of Edinburgh on 4 November 2020 to launch his two new reports for REF on:
Wind Power Costs in the United Kingdom and
The Performance of Wind Power in Denmark
For a recording of the event, please click here.
The reality of what will happen to the costs of key renewable energy and other low carbon technologies is critical. There is, however, a major problem with all of the projections produced by official agencies, academics and other organisations. Put bluntly, they are the product of wishful thinking applied to notional projects in the future with little or no connection to commercial reality.
Figure 1 shows the evolution of capex costs for onshore wind since the early 2000s when the modern technology using turbines with a capacity of 2+ MW became standard for utility scale projects of 10+ MW.
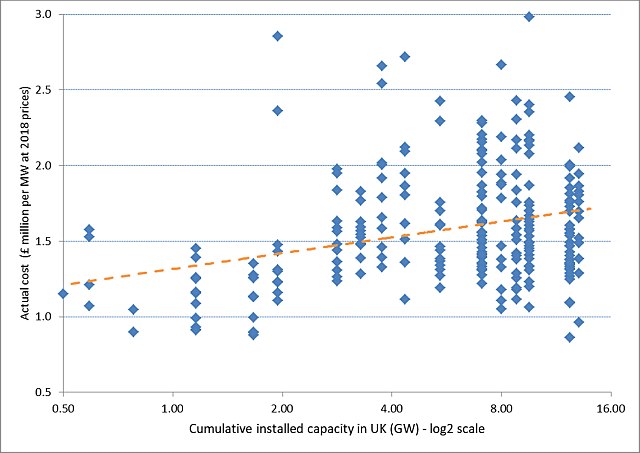
Figure 2 shows the equivalent data for UK offshore wind projects. In this case the average capex costs include the cost of the offshore transmission system, since this is an essential element of any project.
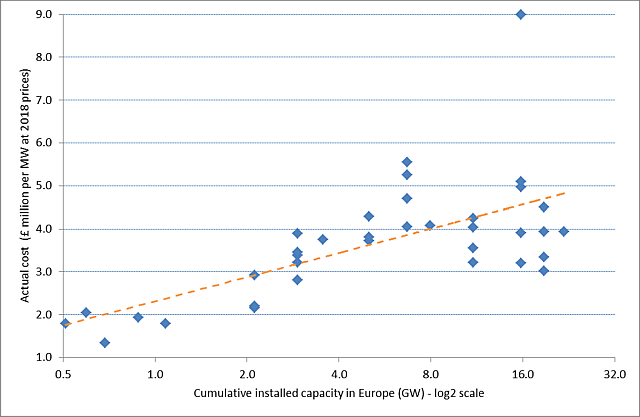
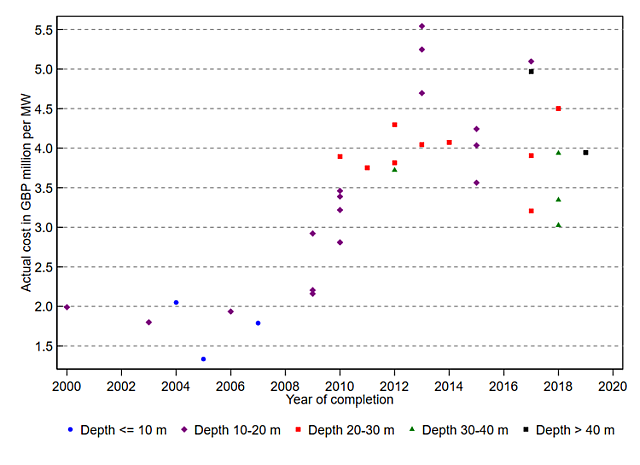
Offshore wind is less mature with global capacity of 3 GW in 2010 reaching 24 GW in 2018. The trend line shows that, leaving out the Hywind project, actual offshore capex costs for UK projects have increased by 15% for each doubling in European capacity. Figure 3 shows the same results but over time with markers that indicate the typical water depth for each wind farm. Statistical analysis confirms that one factor contributing to the increase in costs over time has been the need to use deeper water sites as offshore capacity has grown. This is a more powerful influence than distance from the coast. Underlying costs are likely to continue to increase because the number of suitable offshore sites with shallow or medium depths is limited. As for offshore oil & gas the costs of building and operating offshore wind farms located at deep water sites in hostile marine environments will inevitably be higher than for the initial set of shallow water projects.
But there is worse to come. Figure 4 and 5 shows the evolution of average opex costs for typical onshore and offshore projects. The graphs are based on analyses of large samples spread over 15 years which allow for turbine size, water depth, OFTO status and other factors. In each graph the blue line shows the costs for a project commissioned in 2008. Note that opex cost is reported in £000s per MW per year at 2018 prices. The reason is that the expected load factor for new projects has increased over time.
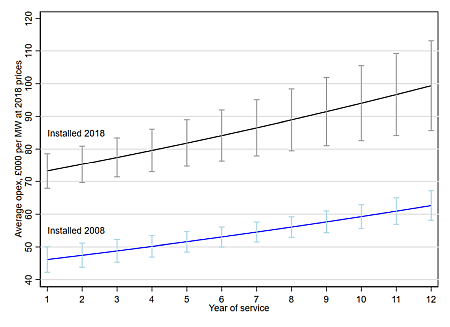
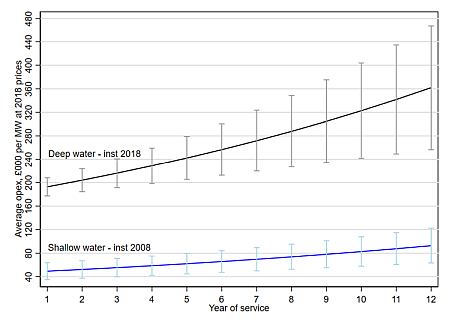
For both onshore and offshore wind the base level opex cost has shifted up significantly over time and costs increase with year of service. Converting offshore opex costs to £ per MWh using an expected load factor of 35% for the 2008 project and 50% for the 2018 project we get initial opex costs of £17 per MWh for the 2008 project and £44 per MWh for the 2018 deep water project. By age 12 the opex cost for the 2008 shallow water project will be £30 per MWh and it will be £82 per MWh for the 2018 deep water project. The wind-weighted average market price of power in 2019-20 was £35 per MWh. This means that at market prices – i.e. without subsidies – offshore wind from deep water projects cannot even cover operating expenses at age 1, let alone earn an adequate return on capital.
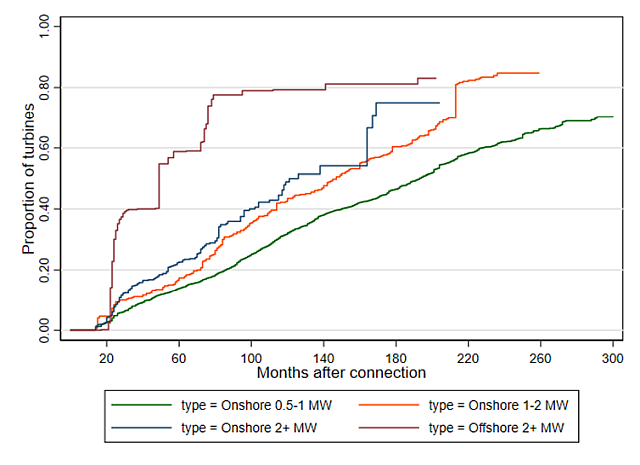
The first part of the study examines equipment failures and major breakdowns. Figure 6 shows the failure curves by turbine category focusing on the time to the first equipment failure. The conclusions are that (i) offshore turbines are less reliable than onshore turbines, and (ii) the older small (< 1 MW) onshore turbines were much more reliable than the 2+ MW turbines that dominate wind farms constructed since 2005. Nearly 60% of offshore turbines will experience an equipment failure in their first 5 years of operation. The reliability of 2+ MW onshore turbines deteriorates over time, so that the risk of failure increases sharply once they have been operating for more than 10 years.
The second part of the Danish study looks at the evolution of the average load factors for onshore and offshore turbines with age after allowing for variations in the distribution of wind speeds and other factors. One major conclusion is that the 2+ MW turbines that were introduced in the early 2000s experienced major performance problems in the period from 2002 to 2010. This is very obvious when such turbines are compared with the smaller turbines of less than 1 MW installed up to 2000. In Denmark – and probably in the UK – the new generation of 2+ MW turbines experienced major teething problems for 5 to 8 years after they were introduced on a large scale. That is an important warning about the effects of generational shifts in turbine technology.
The third major conclusion is that the average load factor for onshore turbines declines at about 3% per year as turbines age, while the average load factor for offshore turbines declines at about 4.5% per year. This means that an onshore wind turbine installed in a location where its load factor, standardised for wind conditions, at age 1 should be 35% can be expected to achieve a standardised load factor of 25% at age 12 years. For an offshore wind turbine the decline might be from a standardised load factor of 55% at age 1 to one of only 33% at age 12.
Once the decline in load factor with age is taken into account, the average opex per MWh for an onshore wind farm installed in 2018 rises from £24 per MWh at age 1 to £42 per MWh at age 12. The equivalent figures for an offshore wind farm are £41 per MWh at age 1 and £125 per MWh at age 12. The increases in opex costs have a drastic impact on the expected economic life of wind farms.
If wind farms do not receive offtake prices that are higher than the market price – or very much higher in the case of offshore wind – their expected revenues will not cover opex costs after 12 or 15 years. Operators will either cease production or drastically cut operating costs leading to closure within a relatively short period. There is no way out of this trap because opex costs are linked to reliability; the decline in reliability with age means that high opex costs must be incurred to maintain production. The consequence is that the assumption made by BEIS and many investors that the expected operating life of new wind farms will be 25 or 30 years is completely at odds with the underlying economic reality. Few modern wind turbines operate for more than 20 years and many offshore wind turbines are likely to be decommissioned before they reach an age of 20 years.
Some general lessons from the study:
1. Stop pretending! The projections of the costs of achieving Net Zero put out by government bodies and many others rely on cost estimates that are just wishful thinking. They have no basis in actual experience and a realistic appraisal of trends in costs.
2. Accelerating arbitrary targets is very expensive. The offshore wind sector does not have the capacity to build new projects at a rate of 3 to 4 times the last decade. It is plausible to assume that capex and opex costs will rise by a minimum of 20% and probably closer to 50% above the already high costs that we observe in the audited accounts.
3. Bailouts of wind farms and financial institutions are inevitable. The Government is creating a situation in which it will have no option other than to bail out failed and failing projects simply to ensure continuity of electricity supply. There will be a game of pass the parcel over how the losses will be distributed but ultimately they will fall largely on taxpayers and energy customers. Any business investor outside the renewable energy sector should plan on the basis that electricity prices in 2030 will be 3-4 times in real terms what they are today.
Read the full article at: Wind Power Economics – Rhetoric and Reality (ref.org.uk)
